As part of my normal routine I track all of the time I spend working on software-related projects and the time I spend playing my trumpet.
Originally this was started as a way to make sure that the time spent on side-projects did not impact the time I spent on my day job. I wanted to make sure the my excitement for my hobbies was not taking away from the commitment I had to my team, and to the company through which I was making a living.
I also tracked my time to make sure I was aware of how much I was actually working. With the commute time and a small team, it can be hard to be aware of how much time is actually passing. It’s easy to overwork or underwork because of inconsistent reference points. I didn’t want small changes in my schedule to result in significant decreases in total work.
In addition to making sure I was following through on my commitments, I really like the fact that I have data on the work I do. I like the graphs, and think it’s cool to be able to look back and see what I spent my time on.
Note: This document is a summary of more extensive analysis that can be found here. That repository contains a Jupyter notebook that will lead you through all of my actual analysis. This post will focus on results only.
Referenced Projects
Day Job
SkinIO
SkinIO is my day job, and where I spend the majority of my time. You can find more information here. In brief, it’s early-warning skin cancer detection software. It uses computer vision and machine learning technology to help patients and dermatologists track changes in skin lesions over time. I’m the lead engineer at SkinIO, and run the tech team.
Side Projects
Uplink
Uplink Sports is a digitial marketing app I built and designed with my brother. You can find more information here and here. It allows people to quickly and effectively design sports marketing material from the field. The targeted audience is smaller programs (high schools, DII, DIII, etc.) that otherwise would not have access to a graphics design department.
Quest
Quest or NavQuest (as the iOS App is named) is a scavenger hunt app I designed and used when proposing to my girlfriend (now fiancée). More information here. It has a well defined JSON spec if you want to make your own quests.
Wedding
Time spent on wedding-related tech, ie: the website. I’m bad at web-design, and it took much more time than I planned.
Other
This includes discussions about a new initiative with a friend of mine in early 2017, time spent planning and prototyping a tool to scrape twitter analytics, and just other tech-related playing around. Any project that turned into a real quantity of time was broken out on its own.
Tracking Details
The time tracking is not perfect, but I am careful to keep as accurate of records as possible. This data is for me, and I try my best to avoid inflating or deflating values. My general rule of thumb is that things over a few minutes get tracked. I’ll respond to Slack messages, check server state, etc. without reporting time. Should that check turn into something more involved I will occasionally backfill the information.
Outside of my engineering work, the only other data I track with this system is my trumpet. I do not play as much as I would like, and I find it helpful to see the weeks and months since I’ve last played as a reminder that I’m long overdue.
Working Hours
One of my favorite parts of Github is the extremely addictive commit/activity graph. I like filling in the holes and when I’m working on projects, I aim to commit once a day or at the least every other day.
To start with, I’m curious what that looks like for my working time, not just my commit timestamps.
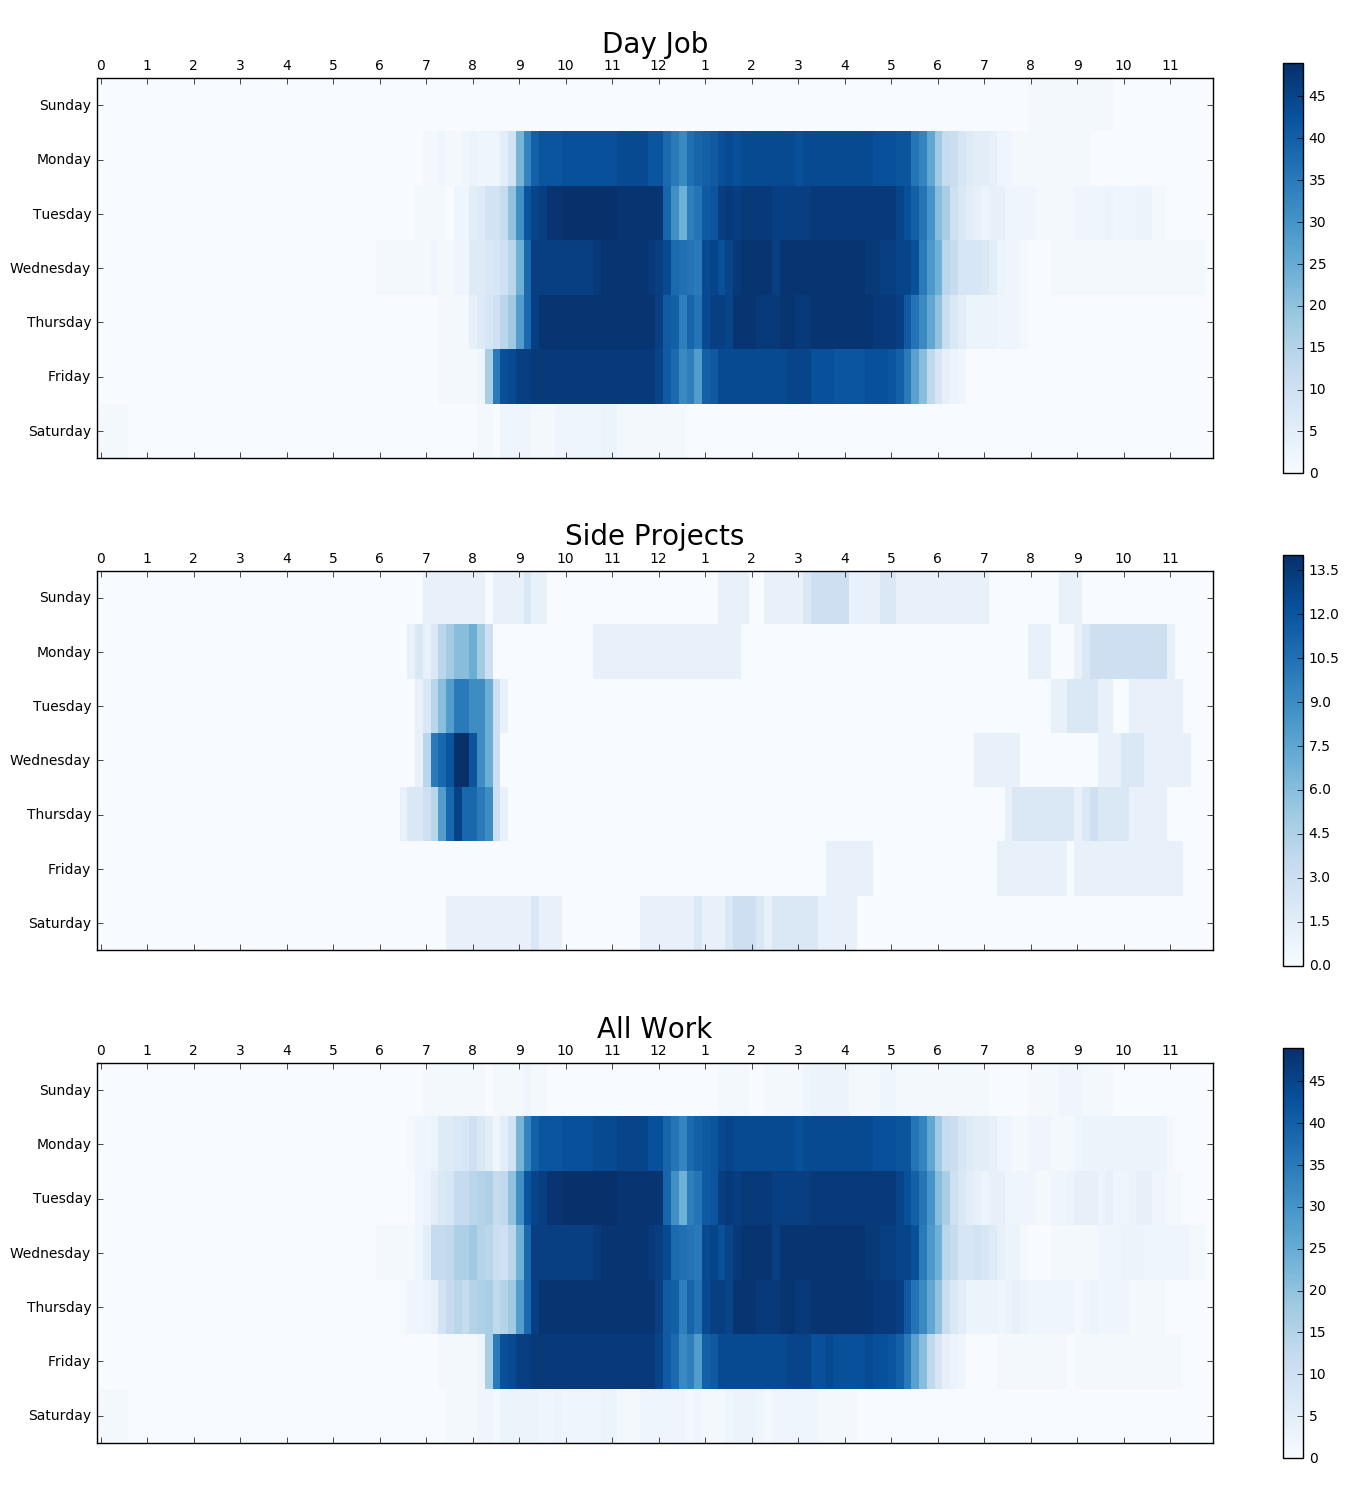
In the results below you can see a pretty clear picture of when I work. I normally get into the office around 9am, and I leave the office around 5:45pm. There is also a very clear picture of Friday mornings. I’m in a men’s group that meets for coffee until 8am, so I normally get into the office a bit earlier.
As far as side-projects are concerned, I normally use Mon-Thursday mornings, as well as evenings and the weekends. That is clear from the graphs below.
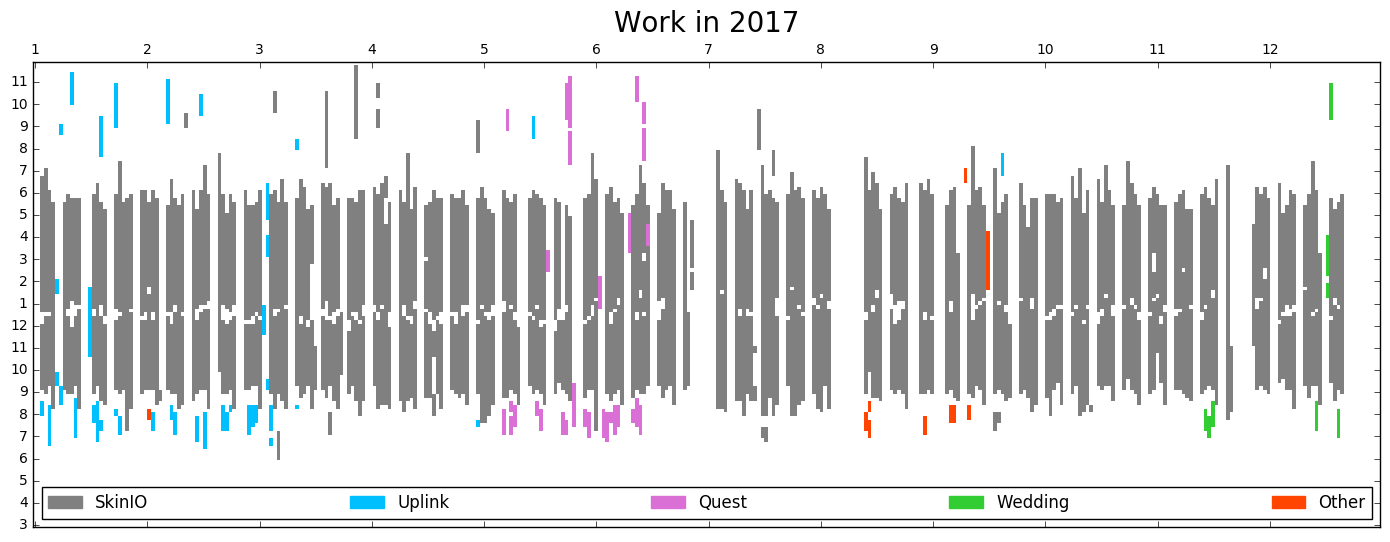
All 2017 Work
After calculating the hours I tend to work, I thought it would be useful to be able to visualize all of my hours over the course of 2017. It’s clear that I do side-projects in the morning, and that I have a consistent work schedule. Is that something that is true for the entire year, or is it something that just looks true because I graphed all of the days on top of each other?
Before trying to analyze trends and changes, I wanted to be able to see what my year looked like. The trends in these results match those found in the Working Hours results. By spreading the year out, it’s also much easier to see trends in my projects, and the normal 2-3 month break between each project I do.
Lunch
From the last two exercises it’s pretty clear that I have a consistent schedule. I wonder how consistent my lunch duration is?
To calculate this, I’m going to look at all entries that:
- Have no break and are longer than 6 hours –> days I didn’t take a lunch that are not half days
- Days with two entries and an end_time before hour 14. (This is to filter one late afternoon coffee-break that skewed the data)
I’m ignoring days with 3 or more entires. I didn’t want to reconcile morning or late evening work on top of a normal day.
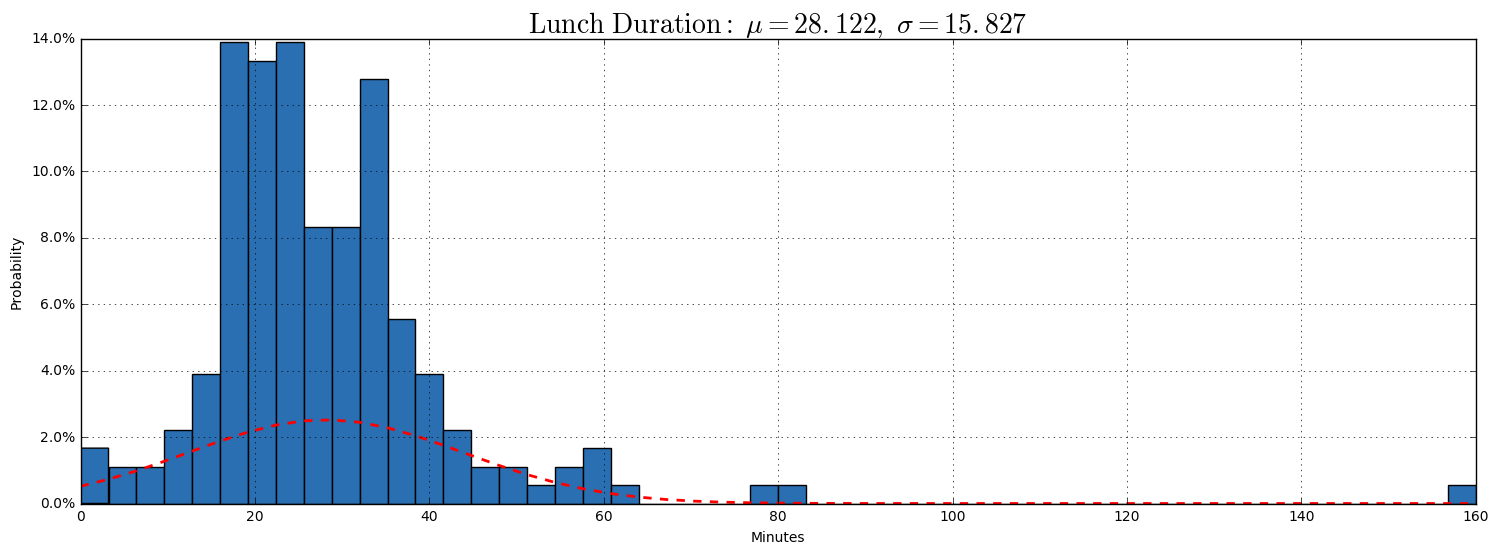
You can see a few outlines for lunch with friends out of the office, and then a stronger grouping on 20-30 minute breaks.
The biggest surprise here is that if you had asked me how long I take for lunch, I would have said 15 minutes every day. 20 at most. 20 is consistent, but by no means the max. I take longer lunches than I realized.
Weekly Hours
It is now quite clear that I work a consistent schedule. The next step is confirming what a normal week looks like for me, and then determining if my ‘normal’ is dependent on the time spent on side-projects.
To run this experiment, I’m going to group all of the data by project by week. This will allow me to quickly analyze against a traditional 40 hr target. From there I can group the weeks to see with and without side-projects and segment by quarter and month.
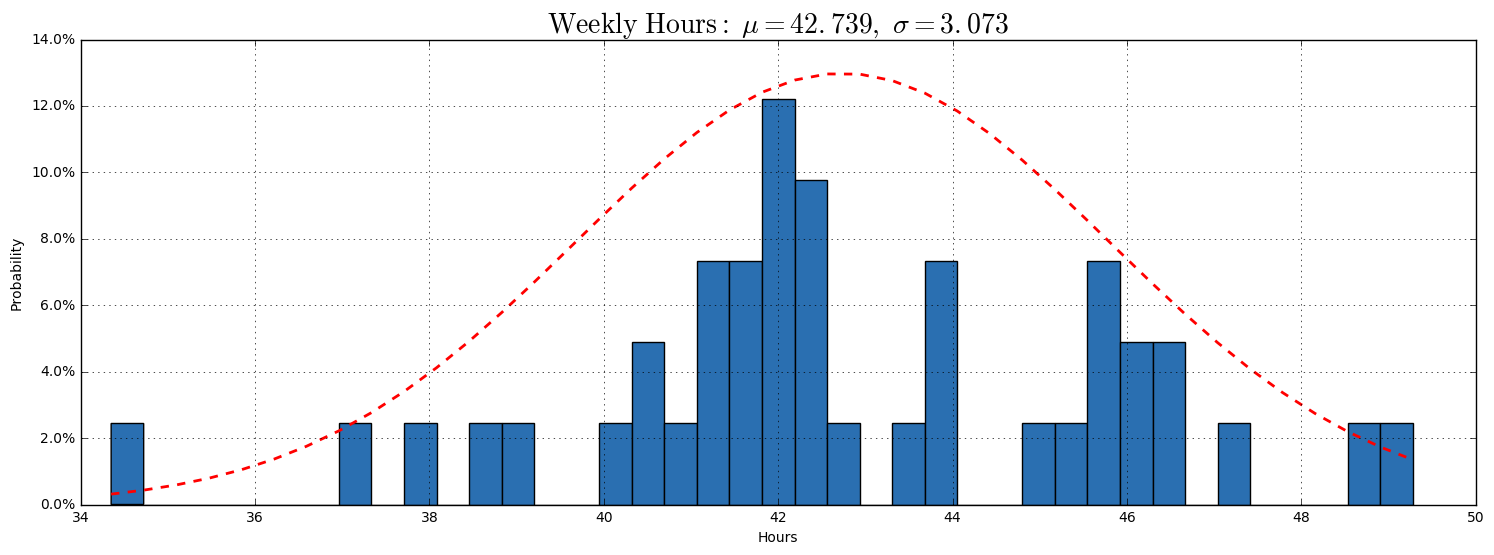
The results clearly show that I have a fair amount of spread. I’m more likely to work more than 40 hours than I am to work less. 40-45 is a consistent range with light weeks dropping down, and heavy weeks going close to 50. This is what I expected, but it’s good to confirm it! Even with a later start time, and a variable lunch, I’m not only consistent with the time I spend at work, but it’s the amount of time I’m trying to spend. 40-45, with fluctuation above and below is my target.
With a baseline established, the next step is to determine if there is a correlation between the weeks I work more and the weeks I work less, and the side-project work that I do. Again, my goal is to (hopefully) see results that show that there is not an impact.
To see the impact of side-project work on normal hours, I’m only going to look at paired weeks. If I did heavy side-project work on a week that was shorter (holidays, days-off, etc) then I don’t want that to skew the other results.
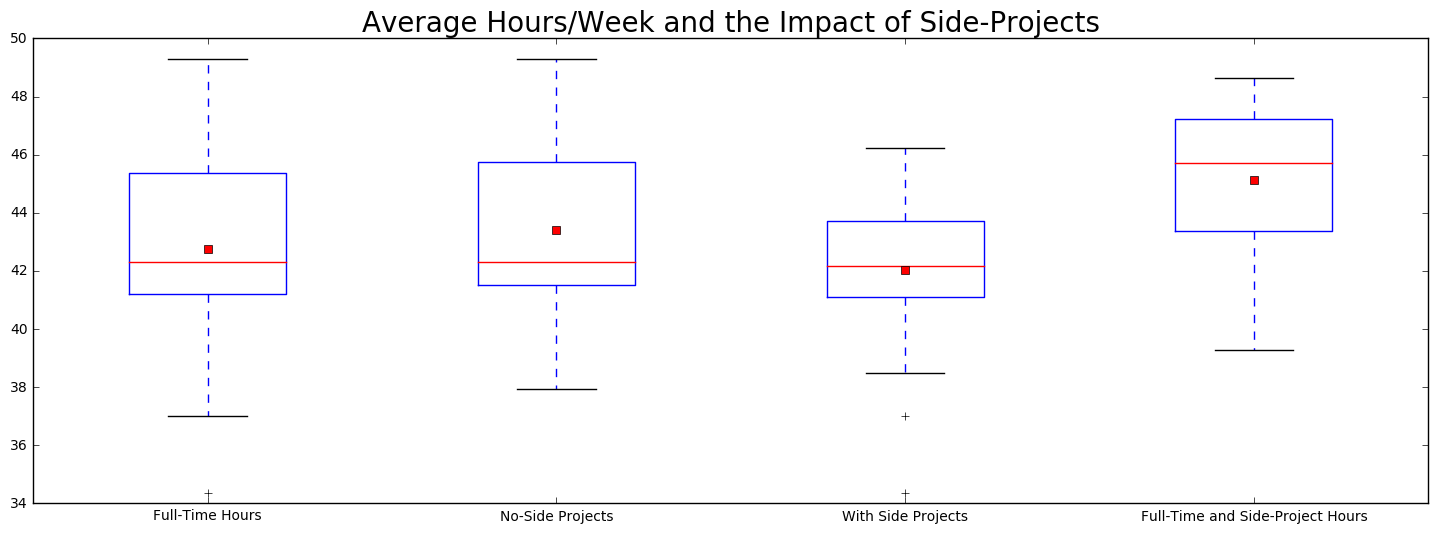
For the graphed results, I would like to see
- Spread in normal full-time work
- Spread of weeks where I do not work on side-projects
- Spread of weeks where I do work on side-projects
- Total spread of all hours (full-time + side-project)
From the results below you can see that my full-time spread is from 37-49, with an average of around 42.x. Those are the same results that the histogram showed (as they should be). When I’m not working on side-projects, there is very little shift in the average, The min moves up slightly, but not very much. On weeks where I am heavily working on side-projects the average does not drop very far, but the maximum time does decrease.
With the previous test it is clear that there is an impact on total work time when I’m doing side-projects. It’s minor, but it is there. That data is over an entire year though, and from the original All 2017 Work graph, it is clear that I don’t work on side-projects consistently throughout the entire year.
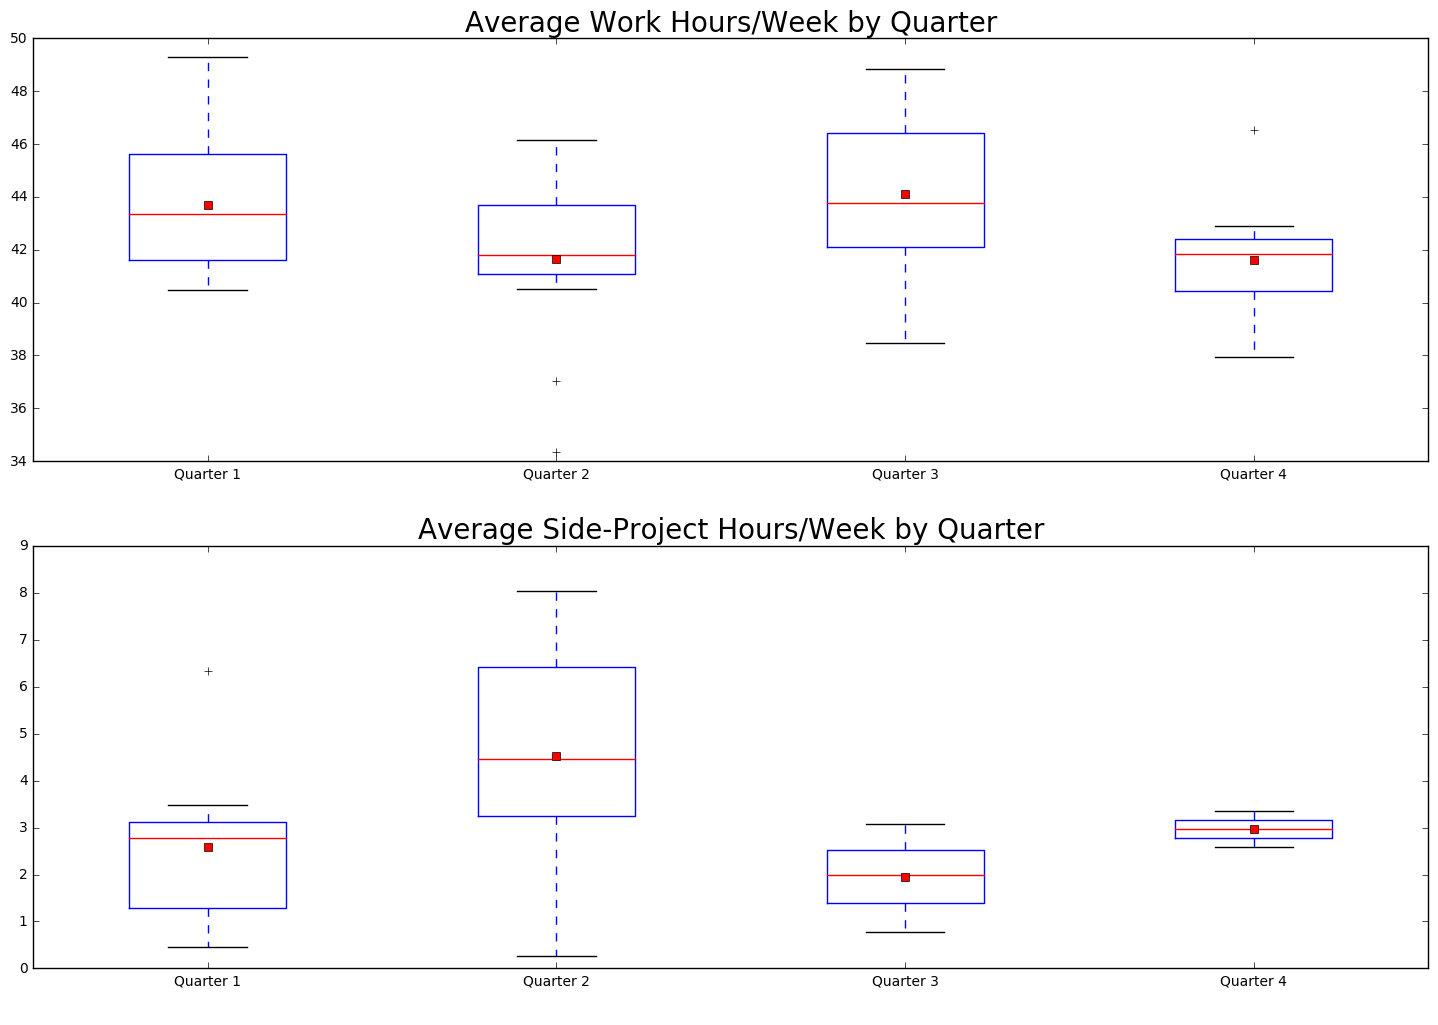
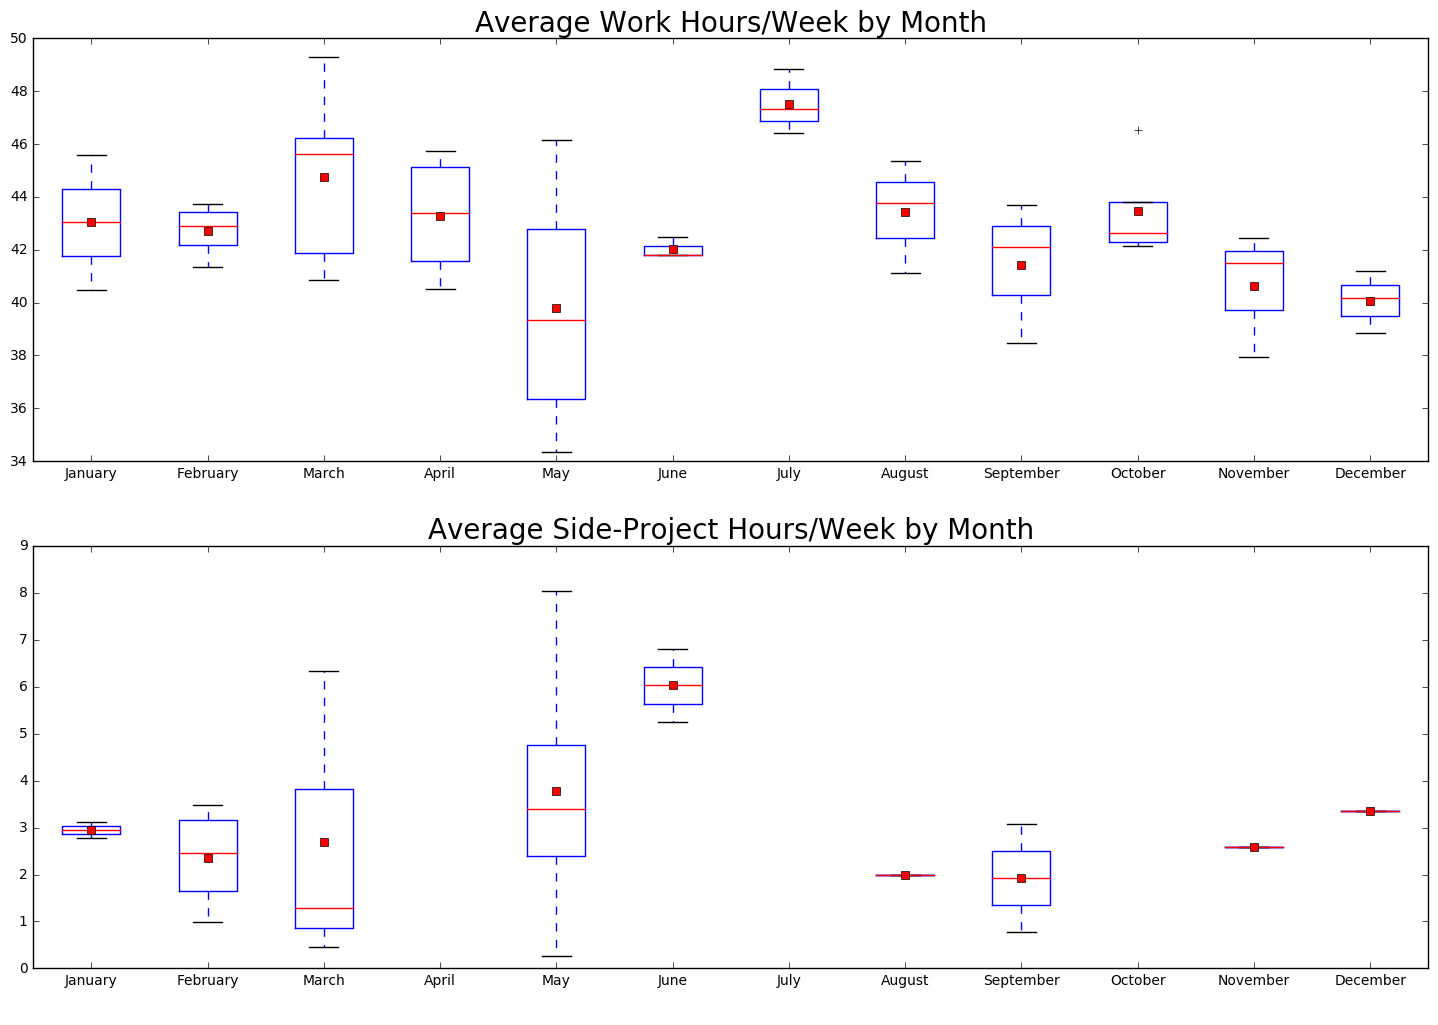
Because I’m inconsistent, and the type of project that I’m working on changes, it would be interesting to see these same results split by quarter, and by month.
Overtime Calculations
With the splits by quarter, and by month it’s clear that sometimes I drop below 40 hours, and sometimes I go well above. It’s also clear that at my peak, side project work may have an impact, but doesn’t definitively take away from time spent at work. In the worst case, it seems to lessen my desire to stay later, because I’m not trying to fill all of my time with a single project.
Looking at the average hours/week by month graph, March and May both have high maxes in both categories. May has a lower min, but that’s because of week 21, when I took an afternoon off.
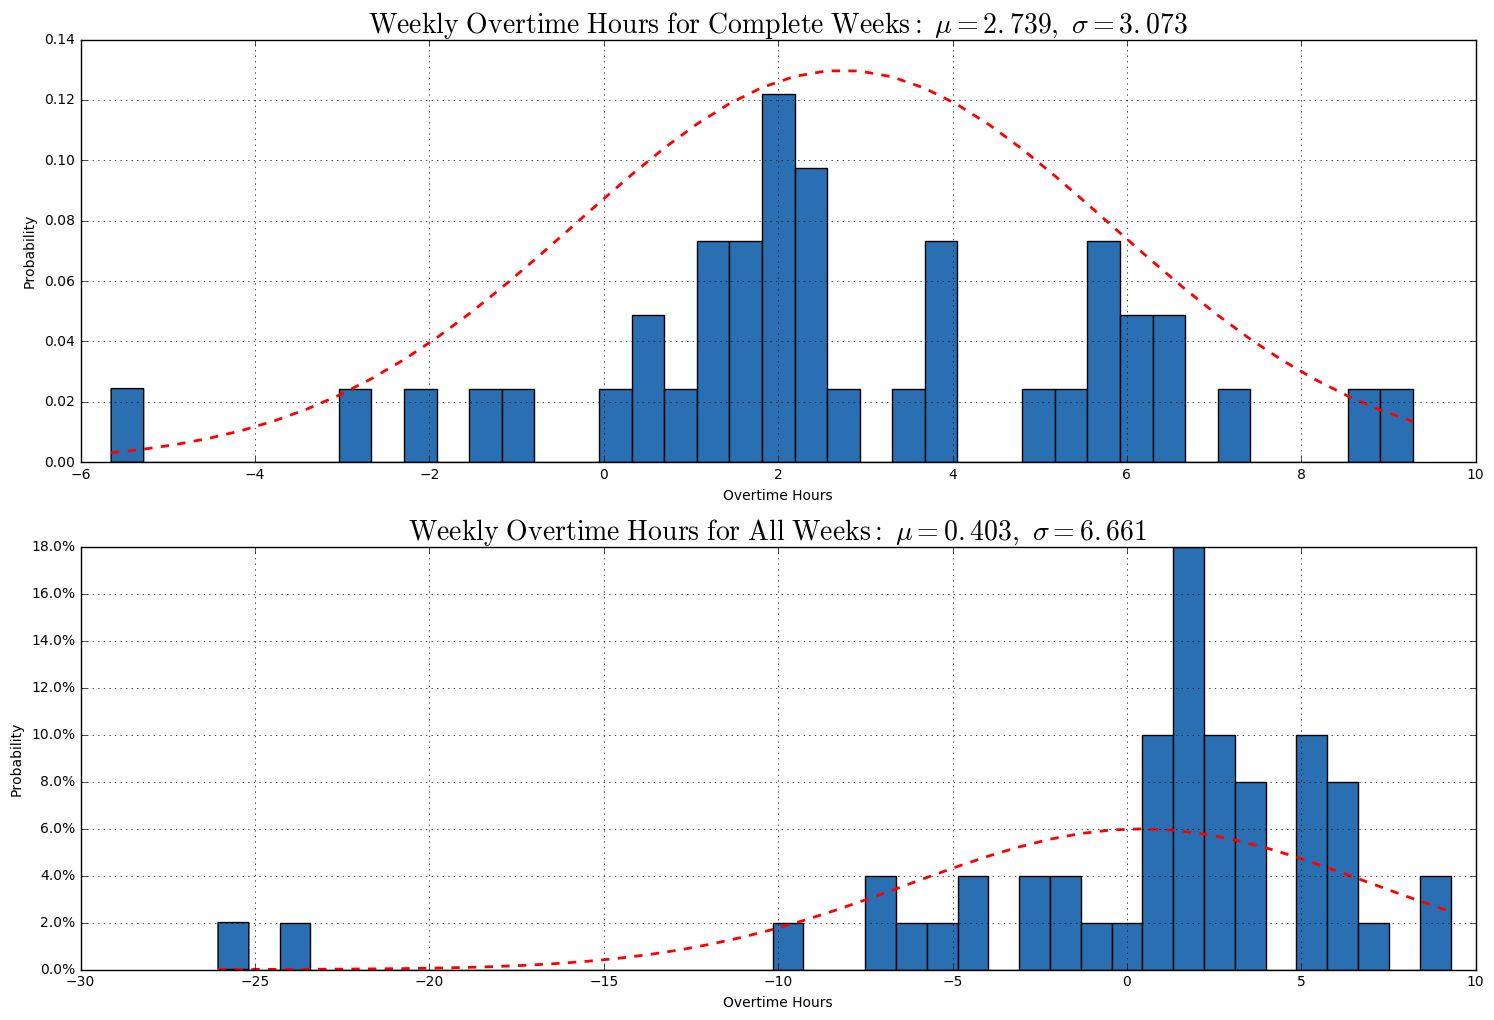
The final test now is to see how my weeks with extra time and less time balance out. The goal here is to make sure that at the worst, my cumulative time is at or over the traditional 40 hour expectation. Proving this is one of the two main reasons that I track my hours.
In this test, I want to not only see if my average for complete weeks balances out, but if I’m also covering the time off. Part of the flexibility of my role is lack of defined vacation time. It allows me to take hours, half days, or full days as needed. In that, and in making sure it is not abused, I want to make sure that I make up for the time I take.
Conclusion
I started out with the goal of proving:
- Time spent on side-projects did not impact the time I spent on my day job
- How much time I was actually working
By looking at all of the recorded time from 2017, you can see exactly when I work. It’s clear when I took a vacation, when I was off for Thanksgiving/Christmas, and when I got sick and was out for a week in June.
It’s clear that I work a pretty regular schedule, and that I have a lunch that ranges from 20-30 minutes.
What is also clear is that even at the peak, when I’m spending about 10 hours a week working on side projects, I still have a minimum time of 40 hours at the office.
And with the days off and flexibility that I have through my role, I make up all of that lost time. I average weeks of 40-45 hours which gives me the room elsewhere as needed.
Improvements for 2018
What is really missing from these graphs is how effective that time is. I’m putting in the hours, but if those hours are less effective, then it doesn’t really matter.
My favorite part of the side projects is the diversity of thought. I find myself more excited both in and outside of work when I have a diverse set of problems to think about. I can see the dip in my max time in the office, but I believe that the time I actually spend working is more effective time. Maybe for 2018 I’ll start tracking happiness and cross reference that with how I complete work, and how often I introduce new bugs. ie: quality of work vs. quantity of work mapped over how happy I am to do the work. Those would be some fun data points.