Background
In August 2018 I started working on Time. I had recently finished analyzing where my time went throughout 2017 and I wanted a tool that would let me see that kind of data continuously. I also wanted to make sure that I would control my own data. There was a lot of blogging chatter at the time around personal data infrastructure and about data ownership and I was swept up in all of it.
The “final” application features were introduced almost 4 years after I started the project. 4 years is a lot of time, and a lot of life happened in that period.
In this post I’d like to share the finished state. Despite all that time, I’m happy with where everything ended up. However, I’d like to share where I went wrong. A bit of a postmortem on the ambitions of the project.
Goal misalignment
I had originally been using an app that was designed for contractors tracking time for client projects. In my software, I wanted to not only address the data ownership problem, but the analytics concerns, and a number of structural problems.
- “Infinite” tree structure (unbounded nesting of categories)
- Distinct User/Account management for shared and individual tracking
- Timezone support for flexibility in analysis by local or reference time
- Analysis and graphs of every type of trend (see: slicing of tree structure)
- Client applications for macOS and iOS
It’s possible to meet these requirements, but they’re not a light feature set. I particularly enjoyed writing a nested set model for #1 and #4, but the technical features never ended up being used. Instead, I implemented analytics in the client.
The biggest “problem” with this project is that I had a public facing sellable product in mind, but I built it progressively as a series of highly technical polished exercises. My client api code automatically queues, retries, refreshes auth tokens and more, and is built on a consistent interface with generics. I used this as a project to test out and model design strategies that I wanted to bring back to my teams professionally.
As time passed life also got in the way. Since this project started I got married, there was a global pandemic, I went through three jobs, and my wife and I had our first child. The biggest step in unblocking myself to finish this project was to take a real step back and to realign what I was building with who it was for, and what it needed to be.
Realignment
I spent years building a tool through without a plan on how I would end up with good analytics, and when I tried to make that jump realized how large of a gap it was.
During those four years I had decided that I didn’t want to productionize this and cut all of the user management features as a result. I pride myself in completing projects, and Time stood at a messy intersection of mostly descoped, but clearly unfinished for my own needs. I’d been exclusively tracking my time in my own software since 2020, but still had no good way to view the data.
While talking through this with a friend, he asked me why I needed to have the graphs and collection tools in the same place. If I controlled the database, why not just use Grafana and let this chapter close? Was completion worth the time? Was is worth the risk of another year on this project and another year of not starting other projects?
I set up Grafana and decided to try it. Back to the nested set and analytics projects I listed above, I had built all of my per-day segmentation, all of my time zone corrections, all of the foundation for how I wanted to view the data exclusively in the iOS application. The Grafana solution could work, but would be a step backwards from what already existed in the app.
So 1/ only the iOS application had the data in the segmented format and 2/ no nuanced graphing would be possible without direct involvement. This means that the best either system could do would be to just display the per day/week/month data that I was already generating.
I could de-scope graphing lunch time, working hours per day, “overtime” and anything else that required more understanding. This scope was narrow enough.
Wrapping up
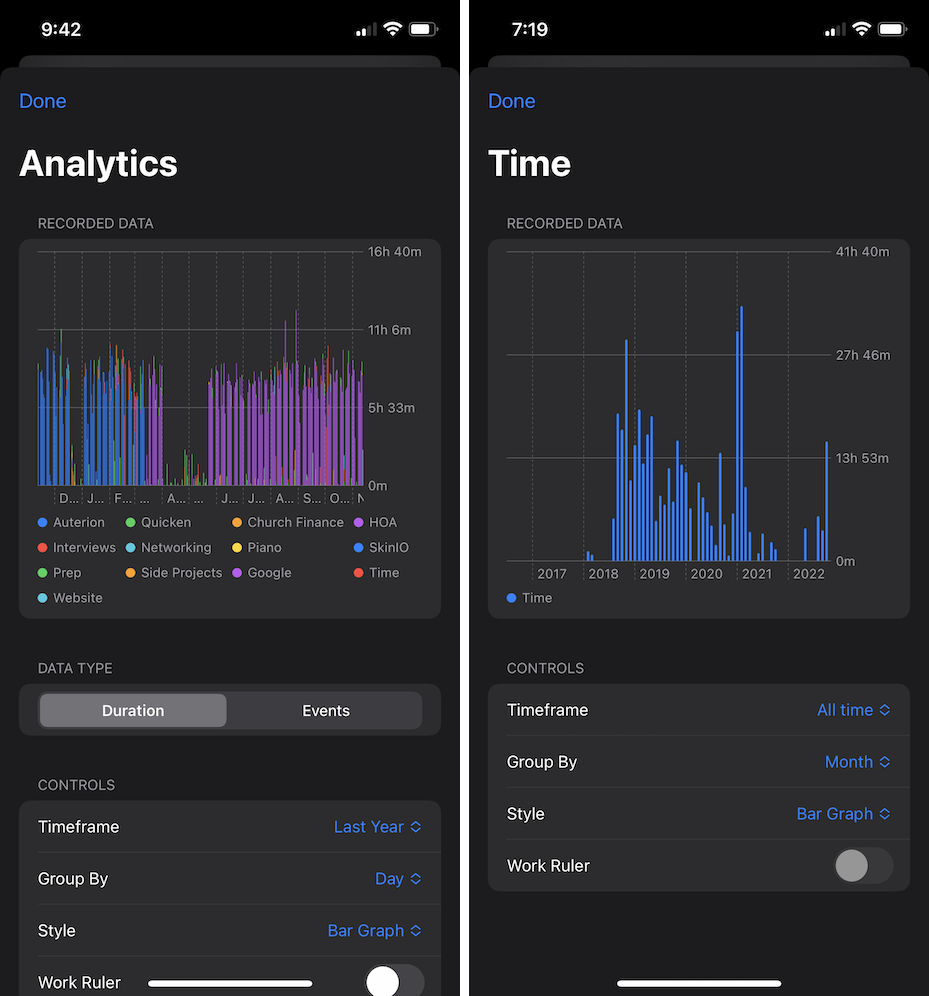
With the scoping clear and a mandate to “display what I already had generated,” wrapping this project up was quick. I used Swift Charts to display the existing data, and accepted all the quirks that came with.
This app is not what I set out to make, but it’s fantastic for me and I use it daily.
It took me far longer than I expected, but when broken out, this is a whole series of tiny side projects and explorations. I’m content with the time spent on this (somewhere around 440 hours), but in the future will be far more careful with how I scope my side projects.
They’re supposed to be fun after all.
The App
And here it is. Years after starting this project, and after collecting data for years before that, I can now finally explore it all.